Exploring Music Through Visualizations

Let's Explore Different Qualities of Music Over Time

Welcome Music Lovers 😀 🎸🀘

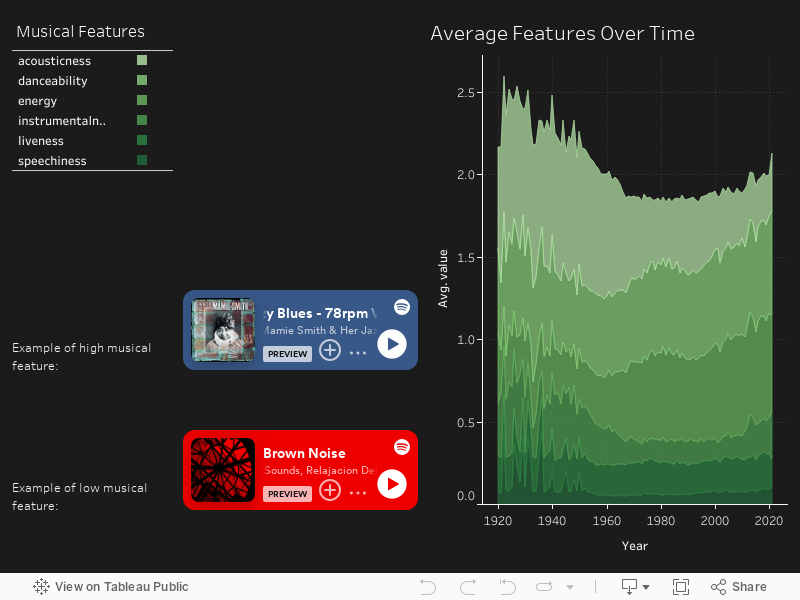
In this project, we hope to explore the different qualities of music thorughout history.


We hope this will be of use to all you music lovers, or those who have more specific intentions of exploring the different aspects of music.


Some tasks that can be carried out after viewing our Visualizations include deciding what kind of musical investments record companies may make in the future. Musicians may also benefit, as they can also adjust their styles to better suit the current trends in music.


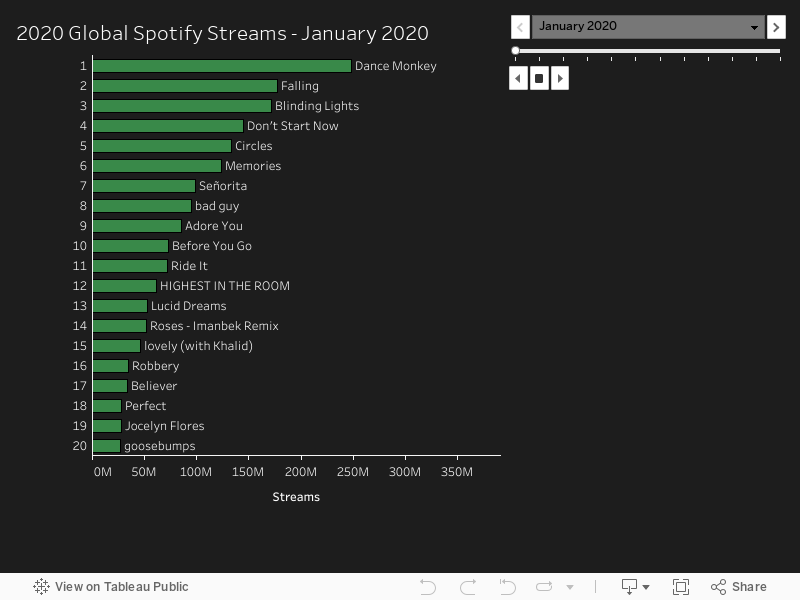
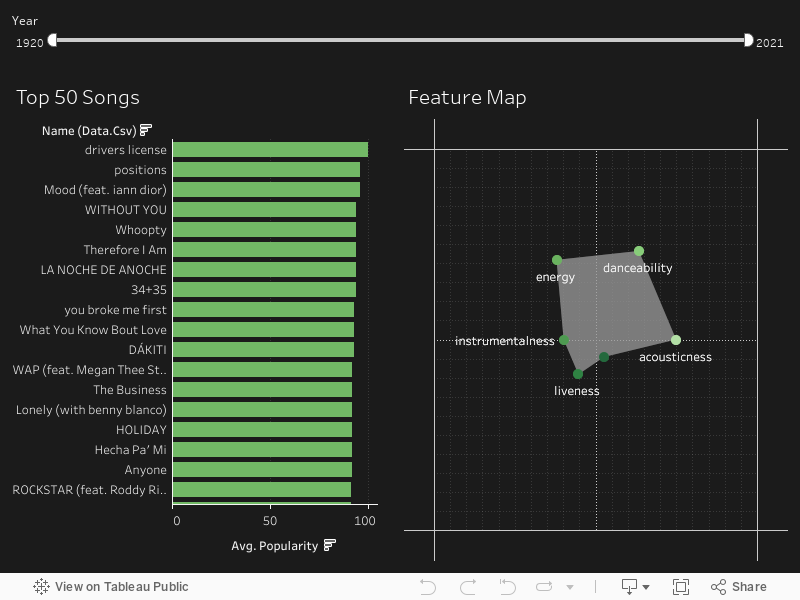
Some insights that can be gained from the information presented on this page incude 
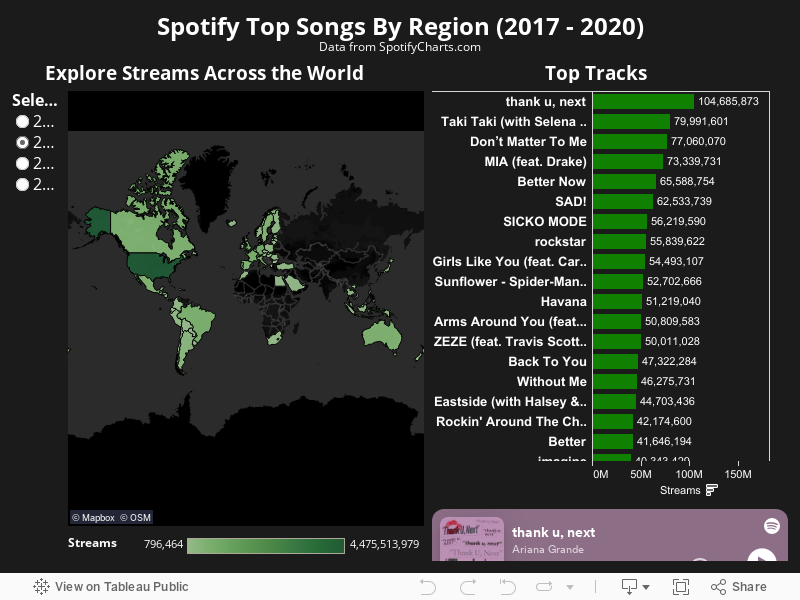
predicting the nect big trends in music, learning musical preferences in different parts of the world, and learning about seasonal shifts in music preferences.


Data has been collected from multiple sources including directly from Spotify, as well as Kaggle projects (of which some are authored by Spotify).

Navigating The Site

spot the explorer

Spot

Spot will be your guide through this exploration of music. In the visualizations below, click on Spot to get more insights on the visuals

Interactive Aid

Vis Info

To help you explore the music through our visualizations, click on the Vis Info icon to get more information on how to interact with the visual

Top Songs By Month in 2020

Insight

Bar chart race of the total global streams in 2020. The first bar from the top indicates the song with the most number of global streams in the world. Blinding Lights by the Weeknd is a top song in June 2020. You are toggle through the months to see when your favorite song was in the number 1 spot.

Interactivity

Toggle through the months in 2020 OR watch the bar chart race by pressing the play button in the upper right hand corner. The button to the right of the square is the play button. The square button is the pause/stop button and the left button is the play in reverse button.

In this section we illustrate our exploration of the hypothesis: What are the trends in top songs lists worldwide in 2020?

Musical Features Over Time

Insight

On the left, there is a map of top songs by number of streams across the globe and by year. On the map, the darker the shade of green, the more overall streams there were in a given year in that country. This is not reflective of how often people stream music or how often they use spotify but may rather be a reflection of the population of individuals who have access to spotify.

Interactivity

In the leged on the upper left hand corner, click on the name of the musical feature in the top left hand corner to see the definition to the right of the legend. After selecting a musical feature of interest, the spotify embeds will show an example of a song that received high and low scores for this feature according to Spotify. Additionally, the area chart on the right hand side shows the average intensity of each musical feature in each given year between 1940 through 2020.

In this section we illustrate our exploration of the hypothesis: What are the trends in top songs lists worldwide in 2020?


Top Songs from 1920 to 2021

Insight

On the top of the visual, there is a scrubber (timeline) that you can move the pointers to specify a time period between the left and right year specifications. On the left hand side of the visual, the bar chart displays the top 50 songs in the specified time period. On the right hand side, the radar chart below shows the average musical qualities of popular songs between the specified time range.

Interactivity

You can use the scrubber on the top of the visualization to look at songs between the two years specified. To see the musical qualities of any song on the top 50 list, click on the bar in the bar chart that corresponds to the song that you would like to see.

In this section we illustrate our explore: How do musical traits of top songs change throughout history?

International Top Charts

Insight

On the left, there is a map of top songs by number of streams across the globe and by year. On the map, the darker the shade of green, the more overall streams there were in a given year in that country. This is not reflective of how often people stream music or how often they use spotify but may rather be a reflection of the population of individuals who have access to spotify.

Interactivity

Select the year and country you would like to see using the radio buttons and clicking on the country on the map. The bar chart on the right hand side shows the number of streams that year in the respective country. You can also click on the bar to listen to a highlight from the song!

In this section we illustrate our explore: What are the trends in top songs lists around the globe over the years?

Top Songs By Genre Between 2017 and 2020

Insight

On the left is a bar chart of the number of top 200 global songs that fall into each corresponding category. Songs categorized as multi-genre songs (by Genius API) were not categorized into one genre over another but are represented in both genres. Top songs are also sorted by the top number of streams and can be further explored through the embedded spotify player.

Interactivity

Click on the bar chart to see the top 10 most streamed songs (between 2017 - 2020) in any of the selected five categories. Hover over any of the bars to see a word cloud of the top lyric words used. Click on any of bar in Top Streaming Songs to play a highlight.

In this section we illustrate our exploration of the hypothesis: What are the trends in top songs lists worldwide in 2020?